Data Analytics Tools: How to Choose, Use, and Integrate Them Into Your Website Strategy
Every click, form submission, and purchase on your website generates data. The question is whether you're turning that data into decisions or letting it collect dust. In 2026, even the smallest businesses can no longer afford to guess their way through marketing, product changes, or website redesigns. Data analytics tools make the difference between reacting to problems and predicting them.
This guide walks you through the major categories of data analysis tools, explains who uses each one, compares the leading platforms head-to-head, and gives you a concrete checklist for assembling your own analytics stack-especially if you're running a small business website.
Key Takeaways
- Data analytics tools turn raw data from websites, CRMs, ads, and payment systems into decisions. Even micro-businesses need them to stay competitive, as organizations generate nearly 403 million terabytes of data daily.
- The right data analytics tools depend on your role (data analysts, data scientists, data engineers, marketers, or founders) and on the complexity and volume of your data.
- Specific tools map to specific jobs: Power BI and Tableau for dashboards, Google Analytics for web traffic, Python and R for statistical analysis and machine learning, SQL for database management, Apache Spark for large-scale data processing, and KNIME for visual, no-code workflows.
- EZPages.Pro websites ship with Google Analytics, Search Console, and privacy-compliant tracking configured from day one, so small businesses can start measuring performance without extra technical work.
- This article includes a step-by-step checklist to help you pick and combine analytics tools for your SMB website and digital products.
What Are Data Analytics Tools? (2026 Definition)
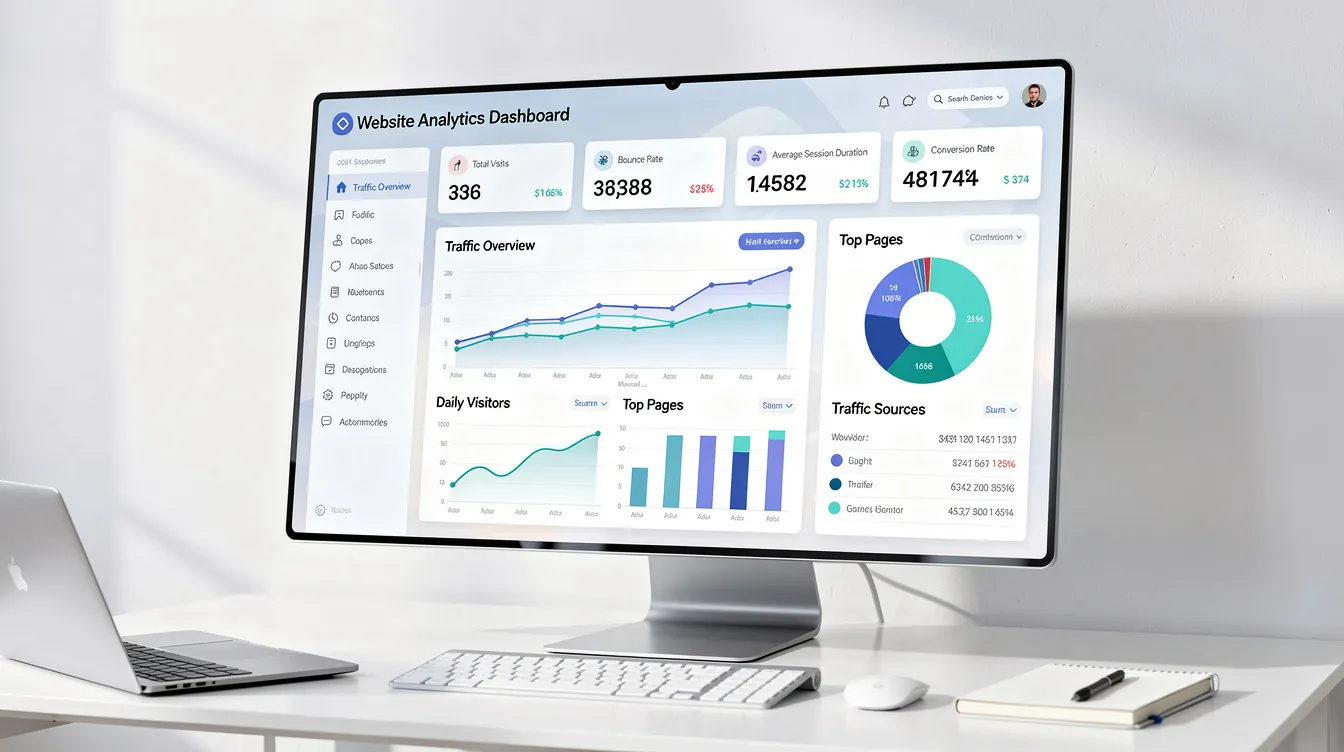
In 2026, data analytics tools are software platforms that collect, clean, model, and visualize raw data from multiple sources into dashboards, reports, and predictive models. The primary value of data analytical tools is to support faster, informed decisions rather than gut feelings.
These analysis tools are software that sit between your data sources-websites, apps, CRMs, payment processors-and decision-makers. They transform complex data into KPIs and actionable insights. Data analytical tools pull data from multiple sources into a unified view and convert raw data into actionable intelligence.
The spectrum is broad:
- Low-code dashboard builders: Power BI, Tableau, Looker Studio
- Programming environments: Python, R, SQL
- Big data engines: Apache Spark, Databricks, BigQuery
These tools are used daily by data analysts, data scientists, data engineers, marketers, and business owners. In practice, most teams combine several tools rather than relying on a single platform. A marketer might live in Google Analytics while a data engineer builds pipelines in SQL, and both feed into the same Power BI dashboard that the founder checks every Monday.
Why Data Analytics Tools Matter for Modern Businesses
Even a small e-commerce store generates thousands of data points per day-page views, cart additions, abandoned checkouts, ad clicks, email opens, payment confirmations. Multiply that across social media, Google Ads, and a CRM, and you're sitting on business data that spreadsheets alone can't handle.
Data analytics tools improve decision speed, accuracy, and reporting. Common KPIs like conversion rate, customer acquisition cost (CAC), and lifetime value (LTV) become trackable and comparable across channels. Choosing the right tool can speed up decisions by five times compared to manual reporting. Data analytics tools enable organizations to track performance and make smarter choices.
Consider a practical example: an e-commerce store uses Google Analytics to identify traffic sources, exports that data to a warehouse, and builds Power BI dashboards. The team discovers that email campaigns produce the highest LTV but also the highest cart abandonment. They redesign the checkout flow and segment email lists accordingly. Data analytics tools help understand customer behavior and identify growth opportunities like this.
Descriptive analytics summarizes historical data using reports and KPIs so you know what happened. Diagnostic analytics explores data to identify causes behind those results. Together, they replace guesswork with evidence. Data analytical tools aggregate data for improved insights across business operations.
At EZPages.Pro, our managed sites are built to capture clean analytics from day one. Instead of spending weeks debugging tracking code, clients can immediately use these tools for real decisions about conversion rate optimization and content strategy.
From Raw Data to Insight: The Data Analytics Workflow
Think of the analytics workflow as a five-step pipeline:
- Data Collection: Raw data flows in from clickstreams in Google Analytics, sales from Stripe or Shopify, lead form submissions from your website CMS, and CRM contact records.
- Data Integration: Data integration connects disparate sources and prepares data for analysis. ETL/ELT tools like dbt or Apache Spark move data into a central data warehouse and handle schema changes.
- Data Modeling: SQL and semantic layers clean, join, and standardize fields. Some tools support a semantic layer for data modeling, creating consistent definitions for metrics like "conversion" or "new user." Data cleaning ensures reliable results by fixing errors and removing duplicates, and data analytical tools automate the removal of duplicate entries and formatting errors.
- Analysis & Visualization: BI tools like Power BI and Tableau build dashboards. Data professionals run ad hoc analysis, regression analysis, or exploratory data analysis.
- Action: Insights drive content changes, UX adjustments, marketing budget shifts, and product decisions.
Data transformation happens between steps two and three-you transform raw data into structured, queryable formats that analysts can actually work with.
EZPages.Pro fits squarely at the collection stage. Our websites and landing pages are designed to capture high-quality event data-form submits, button clicks, page scrolls-that flows into downstream analytics tools without extra development work.

Key Roles: Data Analysts, Data Scientists, and Data Engineers
Who uses which analytics tool? Here's a quick guide:
- Data analysts focus on dashboards, SQL queries, and Power BI or Tableau reports. They perform ad hoc analysis for marketing, finance, and operations teams, turning customer data into weekly or monthly reports that guide strategy.
- Data scientists go deeper. They use Python, R, machine learning algorithms, and sometimes Apache Spark to build predictive models, run experiments, and explore data in ways that standard dashboards can't support. Data science work often drives segmentation, forecasting, and recommendation engines.
- Data engineers build the infrastructure. They specialize in data pipelines and warehousing using SQL, dbt, Spark, and data integration tools. Their job is database management and delivering clean, modeled data to analysts and BI layers.
In job postings for data analysts in 2026, roughly 74% require BI tool skills, 72% require SQL, and 54% require Python. Spreadsheets appear in only about 36%.
In small companies, one person often wears all three hats. That's why choosing versatile data analysis tools that cover more than one role is especially important for SMBs.
Core Categories of Data Analytics Tools
Before diving into individual tools, it helps to map them into mental buckets. Here are the top data analysis tools organized by category:
- Spreadsheet tools (Excel, Google Sheets)
- Self-service BI and dashboard tools (Power BI, Tableau, Looker Studio, Qlik)
- Web and product analytics tools (Google Analytics, Mixpanel, Amplitude)
- Programming and scripting tools (SQL, Python, R)
- Big data and distributed processing tools (Apache Spark, Databricks, BigQuery)
- Visual workflow and no-code analytics tools (KNIME, Alteryx)
- AI-assisted analytics tools (built-in ML, copilots, generative AI features)
Each data analytics platform serves a different stage of complexity. A startup tracking basic website traffic doesn't need Spark. A global retailer processing billions of events can't survive on Google Sheets. The best data analysis tools for your business depend on where you sit on that spectrum.
Spreadsheets: Excel and the Gateway to Data Analytics
Spreadsheets remain the default starting point for many teams in 2026, even alongside sophisticated BI platforms.
Microsoft Excel allows extensive data manipulation and visualization through pivot tables, formulas, conditional formatting, and basic charts. Google Sheets adds real-time collaboration and easy sharing. Both are fine for small-scale data modeling, quick exploratory data analysis, and one-off reports.
But practical limitations are real:
- Excel caps at roughly one million rows
- Collaboration at scale gets messy-version control is manual
- There's no centralized governance or semantic consistency
- Data manipulation with formulas breaks when datasets grow
Spreadsheets are enough for small datasets, early-stage startups, and one-off reports. When you start combining website data with CRM contacts and ad spend, or when multiple people edit the same file, it's time for dedicated BI tools.
Many EZPages.Pro clients begin tracking website performance by pulling Google Analytics reports into Google Sheets. As complexity grows, they graduate to BI platforms that handle larger datasets and governed, shared dashboards, reflecting the broader shift toward web analytics as a foundational part of digital strategy.
Self-Service BI & Dashboard Tools: Power BI and Tableau
Business intelligence platforms emphasize visual storytelling and dashboards. They're the backbone for executive and team reporting built on structured data.
Microsoft Power BI offers interactive visualizations and business intelligence capabilities. It features strong data modeling with DAX, tight integrations with Azure Machine Learning and Excel, and is ideal for organizations standardized on Microsoft 365. Power BI connects to various data sources for unified analytics-from SQL databases to cloud services to flat files. Pricing starts at roughly $10–14 per user per month, making it accessible for SMBs.
Tableau is widely used for creating interactive dashboards and visualizations. Its drag and drop interface makes it intuitive for visual storytelling, and it handles complex data sources with minimal coding. Tableau allows users to create interactive dashboards easily, with nuanced control over layout and spatial/geospatial visualizations. Creator licenses run around $75/user/month, which is significantly pricier.
Comparing Power BI Tableau side by side: Power BI wins on cost and Microsoft ecosystem integration. Tableau wins on visual depth and multi-platform flexibility.
Data visualization tools transform complex metrics into interactive reports, and both platforms deliver here. Other notable players include Qlik, which provides self-service data analytics and business intelligence solutions, and SAS, a suite of software for advanced analytics and business intelligence. Looker connects directly to data sources for real-time access, while tools like Google Charts produce interactive visualizations for web applications and Datawrapper is designed for creating online charts and maps.
For EZPages.Pro clients, a BI tool can layer on top of website and marketing data:
- Connect Google Analytics to Power BI for traffic and conversion dashboards
- Blend CRM data with website behavior to visualize data across the full funnel
- Schedule automated reports for leadership instead of manual exports
Web & Marketing Analytics: Google Analytics and Beyond
Google Analytics helps businesses understand user interactions on their websites. GA4 is the de facto standard for tracking traffic sources, events, conversions, device behavior, and audience segments-especially for SMBs.
On an EZPages.Pro site, GA4 can measure:
- Page engagement rates and scroll depth
- Lead form submissions and site-level data analysis
- Checkout funnels and cart abandonment
- Geographic distribution of visitors
Google Analytics connects downstream into BI tools for deeper analysis. You can export GA4 data into BigQuery, then visualize it in Power BI, Tableau, or Google Data Studio (now Looker Studio). This lets you blend web analytics with offline or CRM data for unified reporting.
One compelling case: an e-commerce brand used GA4 exports into BigQuery to build a behavioral propensity model, growing revenue roughly 33% without increasing traffic.
EZPages.Pro routinely configures Google Analytics and Search Console as part of our integrated analytics setup. Integrated functionality includes custom CMS setup and analytics tracking, ensuring that tracking is privacy-compliant with GDPR/CCPA and aligned with ADA/WCAG accessibility standards.

Programming & Scripting Tools: SQL, Python, and R
For technical users who need maximum flexibility and control, programming languages remain indispensable.
SQL is the standard language for managing relational databases-and also the standard language for relational database management in data warehouses like Snowflake and BigQuery. It's the structured query language that data analysts, data scientists, and data engineers use daily to extract and aggregate data. In the UK public sector, roughly 41% of analysts use SQL regularly.
Python is a popular programming language for data analysis and scientific computing. It's a general-purpose open source programming language with rich analytics libraries. Python's libraries include pandas, NumPy, and Matplotlib for data cleaning, automation, statistical analysis software workflows, and machine learning. Python is favored for data analysis across industries.
R is favored for statistical analysis and data visualization, especially in research, healthcare, and finance. R is dedicated to statistics and data visualization, with strong packages like ggplot2 for graphical interface work and over 15,000 open-source packages for data analysis.
A common workflow: raw data from a website and CRM lands in a data warehouse. SQL pulls and shapes the data. Python or R performs deeper analysis or machine learning. Results are pushed into BI tools for visualization through interactive dashboards.
Big Data and Complex Data Processing: Apache Spark and Distributed Engines
This section is for readers dealing with very large datasets or complex data that exceeds what a single machine or simple BI tool can handle.
Apache Spark is designed for large-scale data processing. It's a distributed processing framework with distributed computing capabilities, used by data engineers and scientists to process millions to billions of rows efficiently in memory across clusters. Big data analytics tools like Spark handle big data processing for streaming analytics, large-scale log processing, and machine learning on high-volume historical data.
How does Spark relate to BI? Spark prepares and transforms messy data at scale-handling large scale data processing that traditional tools choke on. The cleaned output is then exposed via SQL or views for Power BI or Tableau to visualize data for business users.
Most EZPages.Pro clients won't need Spark directly. But agencies or SaaS platforms analyzing cross-client or global usage data might incorporate it behind the scenes for data processing at scale.
Visual Workflow & No-Code Analytics: KNIME and Similar Platforms
Not every team wants to write code. KNIME Analytics Platform is an open-source tool that lets data analysts build end-to-end flows for data integration, data transformation, and data modeling by connecting nodes through a visual interface-essentially a graphical interface for analytics.
A concrete example: import Google Analytics exports, CRM contacts, and email campaign data into KNIME, then build a lead-scoring or churn-prediction model using its drag and drop interface. No Python required, though KNIME integrates with Python, R, and SQL for hybrid workflows where technical users extend what non-technical users build.
Agencies or larger EZPages.Pro partners might use KNIME on top of Duda-powered sites to prototype advanced analytics capabilities without full custom engineering. It's a practical middle ground between spreadsheets and code-heavy stacks.
AI and Machine Learning in Data Analytics Tools
Since 2024, AI and machine learning have moved from optional add-ons to built-in capabilities across major analytics tools. Data analytics tools utilize machine learning for anomaly detection, automated forecasting, and pattern recognition.
BI platforms like Power BI and Tableau now include automated insights that help users spot trends faster. AI automates data analysis processes for faster insights, and AI tools can clean and visualize data efficiently-reducing hours of manual prep. AI enhances decision-making by identifying data patterns that humans miss, and AI agents can perform analysis with minimal human supervision.
Generative AI can generate code for data analysis tasks-writing SQL queries, DAX measures, or Python scripts from natural language prompts. According to TDWI research, roughly 62% of respondents are now using commercial generative-BI products.
Predictive analytics uses statistical models to estimate future outcomes, and prescriptive analytics suggests possible decisions based on those predictions. Data analytical tools apply statistical models to forecast outcomes and assess risk, and data analytical tools can automate insights and recommend actions through advanced analytics.
For EZPages.Pro clients, practical applications include automated prediction of which landing pages should be A/B tested next, or identifying which blog topics drive the highest organic conversions using machine learning on website analytics data—often working hand in hand with essential SEO tools for small businesses to improve search visibility.

How to Choose the Right Data Analytics Tools for Your Business
Picking the right data analysis tool doesn't start with features-it starts with your situation. Here's a step-by-step checklist:
Step 1: Clarify your goals. Are you tracking basic website traffic, building full-funnel dashboards, or running predictive models? Identify your primary users-founders want overview dashboards; marketers need campaign metrics; data professionals need flexible query tools.
Step 2: Assess data volume and complexity. Simple website metrics from a single site need only Google Analytics. Multi-channel, multi-country complex data across CRM, ERP, and SaaS tools requires a data warehouse and BI layer. Consider user expertise when selecting a data analysis tool.
Step 3: Evaluate technical skills. Business users thrive with intuitive interface tools like Looker Studio and Power BI. If you have data scientists or data engineers, code-heavy stacks (Python, SQL, Spark) unlock more power for data exploration and data mining.
Step 4: Check integration and compliance. How do tools connect with your website platform-like Duda with EZPages.Pro-your CRM, and payment processors? Do they support GDPR/CCPA and access control? Price and licensing vary widely among data analysis tools, so map costs against actual needs.
Step 5: Start small. Begin with a core stack (Google Analytics + Looker Studio or Power BI). Add specialized tools like Spark, KNIME, or dbt only when clearly needed. Data analytical tools allow users to filter and sort data using SQL or natural language, so most stacks grow incrementally.
Building a Practical SMB Analytics Stack with EZPages.Pro
Here's how a small business can assemble a realistic analytics stack around their website:
Baseline stack: An EZPages.Pro website on Duda + Google Analytics + Google Search Console for traffic and SEO + basic Excel or Google Sheets reporting. This is free or near-free and delivers valuable insights about content performance. SEO optimization aims to improve organic visibility and growth for websites, and this stack covers it.
Intermediate stack: Add Power BI or Tableau for multi-source dashboards connecting website, CRM, and e-commerce data, and extend your site with integrated apps that enhance website functionality. Use SQL queries to a cloud data warehouse like BigQuery when needed. This is where you start building a website that truly drives business growth.
Advanced stack: Incorporate Python or R for machine learning and predictive models, optional KNIME for visual pipelines, and possibly Spark for heavy log or event data. This level typically requires at least part-time specialist help.
EZPages.Pro supports these setups by implementing tracking, ensuring fast and stable sites so data isn't skewed by performance issues, and collaborating with client data teams on integrations. Professional website management services keep custom web design focused on conversion and delivered quickly in a managed service environment, so the foundation is solid from day one. Ongoing site management includes backups and content updates to ensure reliability of both the site and its analytics. ADA and WCAG compliance ensures that websites are accessible to all users, which also affects analytics accuracy.
Common Pitfalls When Implementing Data Analytics Tools
Even the best data analysis tools fail when implementation goes wrong. Watch for these mistakes:
- Inconsistent data across tools: Different event names in Google Analytics vs. your CRM creates messy data that no dashboard can fix. One brand, Hamilton Beach, achieved 99% tracking accuracy only after rebuilding their entire analytics foundation-and then saw a 661% lift in ROAS.
- Skipping data modeling: Jumping straight to dashboards without defining what "conversion" or "new user" means leads to conflicting metrics.
- Tool sprawl: Teams accumulate overlapping analytics tools without clear ownership. Three dashboards showing different revenue numbers destroy trust in data.
- Neglecting documentation: When the one person who built the dashboard leaves, the entire analytics capability leaves with them.
Clean, integrated data from well-designed websites and forms matters more than buying the most expensive analytics tool. EZPages.Pro mitigates common pitfalls by designing consistent events, form fields, and URL structures, making later integration and data management simpler, especially when paired with ongoing website management services for small business growth. Data analytical tools create interactive dashboards and charts to communicate trends-but only when the underlying data is trustworthy.
How EZPages.Pro Turns Analytics Into Actionable Website Improvements
At EZPages.Pro, we use data analytics in our own workflows to optimize client websites. We analyze Google Analytics funnels, review site analytics data, and monitor conversion metrics to guide design and content decisions.
Here are two scenarios we've seen play out:
A global client spanning several countries noticed high exit rates on their services page. Analytics revealed that mobile users were bouncing at a specific section with slow-loading elements. After redesigning that section for speed and clarity, lead form submissions increased measurably within weeks.
A local service business adjusted their homepage content based on search behavior data from Google Search Console and engagement data from GA4. Pages that ranked but didn't convert were rewritten with clearer calls-to-action, resulting in higher inquiry rates.
Data analytical tools automate insights and recommend actions through advanced analytics, but closing the loop between insight and action is where managed services shine. Clients bring their own analytics stack-Power BI, Tableau, Python scripts-and EZPages.Pro ensures the website side feeds the right data into those tools. We collaborate with both non-technical owners and technically sophisticated partners, including other Duda agencies, often as part of managed website services that centralize hosting, security, and updates.
Frequently Asked Questions About Data Analytics Tools and Websites
Which data analytics tool should I start with if I only have a website and no data team?
Start with Google Analytics for traffic and behavior data, Google Search Console for SEO performance, and simple dashboards in Looker Studio or Excel. This stack is free or low-cost and integrates easily with sites built by EZPages.Pro on the Duda platform. Upgrade to Power BI or Tableau once you need more complex, cross-channel reporting. Starting small avoids overwhelm while still delivering actionable insights about content performance and conversions.
How do I know when it's time to move from spreadsheets to a BI tool like Power BI or Tableau?
Key triggers include hitting Excel's row limits, having multiple team members editing copies of the same file, and spending too much time manually refreshing reports. When errors, version confusion, or slow performance appear frequently, it's time to centralize. BI tools also become essential once a company wants standardized KPIs and scheduled dashboards. Talk with EZPages.Pro or your data partners when you begin combining website, CRM, and sales data regularly.
Can I use data analytics tools without hiring a full-time data analyst?
Yes. Many tools are designed for non-technical business users-Google Analytics, Looker Studio, and entry-level Power BI dashboards all offer an intuitive interface with guided setups and templates. Small teams often start with occasional consultant support rather than in-house hires. EZPages.Pro configures core analytics for clients and collaborates with external analysts as they grow. More advanced stacks involving SQL warehouses, Spark, or machine learning models usually benefit from at least part-time specialist help.
How do data analytics tools handle privacy laws like GDPR and CCPA?
Tools like Google Analytics and major BI platforms provide features for IP anonymization, consent handling, and data retention controls-but configuration is the user's responsibility. You must implement cookie consent banners, update privacy policies, and control what data enters analytics tools. EZPages.Pro builds sites with privacy and accessibility in mind, helping clients align analytics implementations with GDPR/CCPA practices. Consult legal experts for industry-specific requirements, especially in regulated sectors.
How does EZPages.Pro integrate with my existing data analytics stack?
EZPages.Pro sites on Duda embed tracking tags for Google Analytics, tag managers, advertising pixels, and custom event tracking required by BI or CDP platforms. Our small-business website builder and hosting services ensure designs, infrastructure, and analytics are aligned from day one. Our team coordinates with your data engineers or analysts to standardize event names, URL structures, and data layers for cleaner downstream modeling. We support ongoing tweaks-adding new events, goals, or funnel steps-without disrupting site performance. You can start simple and gradually layer in more sophisticated tools as your needs mature.
Turn Your Website Data Into Decisions With EZPages.Pro
Having the right data analytics tools is only half the equation. You also need a fast, secure, and well-structured website that collects reliable data in the first place.
Partner with EZPages.Pro to launch or rebuild your website in as little as 5–7 days with our templates (or 2–4 weeks for fully custom builds), with Google Analytics and core tracking configured from day one. Our affordable website plans for startups and small businesses combine managed services that cover hosting, enterprise-grade security, SEO optimization, ADA/WCAG compliance, and ongoing updates that keep your analytics trustworthy over time, all backed by clear service terms and website policies.
Whether you're a small business owner ready to visualize data for the first time or a Duda agency looking for white-label builds with analytics-ready configurations that plug into Power BI, Tableau, and other top data analytics tools-we're ready to help.
Contact EZPages.Pro to turn your raw website data into a clean, actionable analytics foundation for your business.

EzPages.Pro specializes in small business web management and web development for small businesses and startups. Our tailored solutions simplify content updates, track performance with analytics, and ensure smooth site operation. With our all-in-one management services, you can focus on growing your business while we handle the rest.
🚀 Let’s build something great together.
EZPages blog